Employee turnover — whether voluntary or involuntary — is costly and inevitable. But the pain it causes employees and employers can be alleviated by better understanding turnover itself. Why do employees term? What can be done to retain talent? Does turnover look different across various demographics?
To answer those questions, I analyzed a dataset comprised of more than 97,000 survey respondents across a variety of regions and industries. The following results, further discussed in our research report Top 5 Predictors of Employee Turnover, represent perceptions from both non-termed and termed employees, with termed employees having voluntary and involuntary exits.
Top 5 Indicators of Employee Turnover
Based on standard items included in Quantum Workplace’s employee engagement survey, I first analyzed differences in favorable perceptions between termed and non-termed employees. The survey items were measured on a 6-point rating scale, with “favorability” consisting of agree and strongly agree responses. All turnover indicators that saw a 10 percentage-point or greater difference in favorability between termed and non-termed employees are grouped into five distinct themes, described below.
Lower Job Satisfaction
When employees are less satisfied with, interested in, or challenged by their jobs, they’re more likely to turnover.
Unmet Individual Needs
If employees don’t feel like the organization is meeting their individual needs (e.g., health and well-being, work-life balance, personal development), they’re more likely to become a retention risk.
Future Misalignment
Employees who are unsure whether they fit into the organizations future are more likely to turnover.
Poor Team Dynamics
Employees are more likely to leave an organization when they express uncertainty about their team members’ effectiveness and the likeability of their immediate supervisor.
Lower Intentions to Stay
When employees indicate that they’re unsure if they’ll stay with the organization — both in the short term or during tough times — they’re more likely to become a retention risk.
Deep Dive: Perceptions Across Tenure and Organizational Size
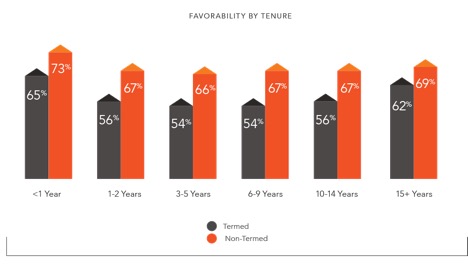
Demographics can be grouped in a variety of ways, and in the context of work, I like distinguishing them in three ways – personal (e.g., gender, age), professional (e.g., tenure, department), and organizational (e.g., industry, size). Although the dataset for this research included a variety of demographic variables, two stood out as having interesting stories to tell. The first, tenure, is a professional demographic. Favorability differences between termed and non-termed employees are shown below, broken out across tenure.

The most fascinating aspect of the above graph is that the gaps between termed and non-termed favorability follow a curvilinear trend. In other words, the gap is smallest for the least and most tenured groups (by 7.6 and 6.9 percentage points, respectively), yet widest for those employees with 6-9 years of tenure (12.6 percentage points). These group-level differences suggest that it doesn’t take as much for new hires or highly tenured employees to term, whereas it takes more uncertain or negative perceptions for moderately tenured employees to term.
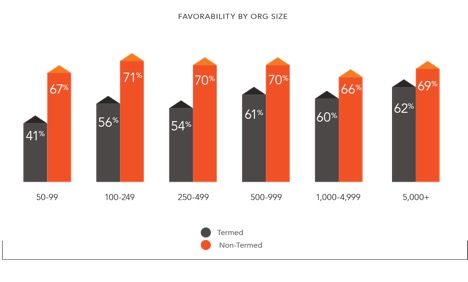
The second interesting story emerged from an organizational demographic – organizational size. Favorability differences between termed and non-termed employees are shown below, broken out across size.

Again with an emphasis on gaps, the above graph shows that the gaps in favorability between termed and non-termed employees mostly follow a linear trend; the gaps in favorability tend to get smaller as organizational size increases. This suggests that it takes more uncertain or negative perceptions to leave a smaller organization, yet not so much for larger organizations.
The results across both demographics indicate that certain groups of employees require greater degrees of misalignment to term. Smaller organizations may be culturally “stickier” in that it takes a fundamental misfit between employee and culture for an employee to term, whereas that lack of fit isn’t as pressing or important for larger organizations. Likewise, moderately tenured employees may need to pushed (or pulled) harder to term because they’re possibly more invested in the organization’s success than less tenured employees, yet have more room for professional growth and development than more tenured employees.
Next Steps
Understanding employee turnover is crucial for saving financial capital and retaining human capital. Although turnover is complex, a “one size fits all” approach to preventing or responding to employee turnover just doesn’t work. For example, retaining or training talent would likely look different for employees with varying tenure, and even for employees across organizations of varying size. A high-level list of turnover indicators is certainly a good place to start, but different strategies are needed for different industries, different departments, and different groups and teams.
Understanding turnover shouldn’t be part of an HR wish list or filed under the mentality of “oh that’d be nice to have someday,” but engrained as part of an organization’s strategy for success. It is imperative to collect and analyze exit data using reliable tools, a strong methodology, and a commitment to implementing insights gathered from those data.
photo credit: Pieter v Marion Office windows via photopin (license)
Post Views: 2,741